
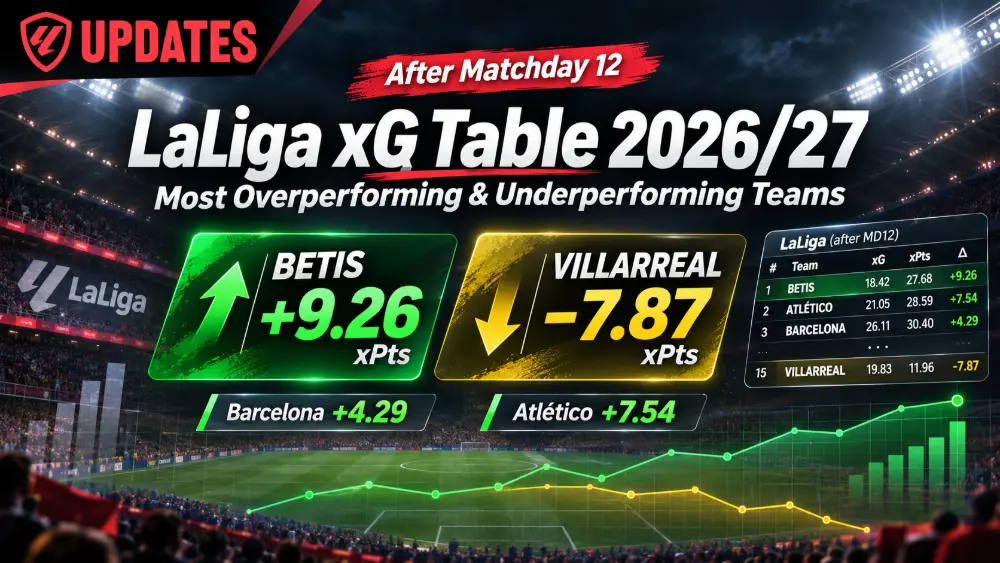
Real Betis and Villarreal tell two very different stories about the 2026/27 LaLiga season. Betis are fourth with 26 points, yet one expected-points model gives them just 16.74 xPts. Villarreal are eighth with 15 points despite generating 22.87 xPts. That is a 17.13-point swing between the teams’ actual-versus-expected gaps — the most striking contrast in LaLiga after Matchday 12.
This LaLiga xG and expected-points analysis for 2026/27 identifies the clubs whose results differ most from the chances they created and allowed. We use official league standings for real points and a consistent third-party model for xG and xPts. Importantly, overperforming does not automatically mean lucky, and underperforming does not guarantee improvement.
Last checked: November 16, 2026. Figures cover completed league matches through November 8 (Matchday 12). Athletic Club and Rayo Vallecano have each played 11 completed matches, not 12, because their earlier meeting remains unfinished. For live rankings see our LaLiga standings and 2026/27 statistics hub.
Jump to: Quick results · Overperformers · Underperformers · How xPts works · What to watch · FAQs.


LaLiga 2026/27 xG Table: The Biggest Points vs Expected Points Gaps
Headline findings: Betis have the largest positive points-minus-xPts gap (+9.26), followed by Atlético (+7.54). Villarreal have the largest negative gap (−7.87), followed by Málaga (−5.04). The league leaders, Barcelona, also sit above their model expectation, but their chance-creation numbers are exceptionally strong.
Five Teams Most Above Expected Points
| Team | Points | xPts | Pts − xPts |
|---|---|---|---|
| Real Betis | 26 | 16.74 | +9.26 |
| Atlético Madrid | 28 | 20.46 | +7.54 |
| Real Sociedad | 22 | 16.00 | +6.00 |
| Barcelona | 33 | 28.71 | +4.29 |
| Real Madrid | 30 | 27.87 | +2.13 |
Five Teams Most Below Expected Points
| Team | Points | xPts | Pts − xPts |
|---|---|---|---|
| Villarreal | 15 | 22.87 | -7.87 |
| Málaga | 5 | 10.04 | -5.04 |
| Elche | 10 | 14.46 | -4.46 |
| Valencia | 9 | 12.82 | -3.82 |
| Celta Vigo | 13 | 16.48 | -3.48 |
How this ranking was built: We subtracted each team’s xPts from its actual league points, then sorted the positive and negative differences. Actual points were checked against LaLiga’s official 2026/27 table; xPts and xG numbers use xgEdge’s 2026/27 expected-points table at the November 16 check. This is one model’s estimate, not an official LaLiga metric.
1. Real Betis: The Biggest Overperformers (+9.26 xPts)
Betis: 26 points from 16.74 expected points. Their fourth-place position is eight points ahead of sixth-placed Sevilla and 11 ahead of Villarreal. Yet their underlying chance balance is close to neutral: 20.10 xG for and 20.76 xGA across 12 league matches.
Here’s the surprising part: Betis have scored 20 actual goals from 20.10 xG. In other words, their unusually strong points total is not primarily explained by spectacular finishing. Instead, they have conceded 15 goals against 20.76 xGA, around 5.76 fewer than the quality of chances conceded would imply. Goalkeeping, opponent finishing and when goals arrive may all affect this gap.
Their latest result illustrates the value of timing: Betis remained level at Elche until late goals from Rodrigo Riquelme and Marc Bartra secured a 2–0 win. See our November 8 Elche–Betis report for the match breakdown. One game does not prove a season-long trend, but narrow victories can produce large points totals without a large xG advantage.
Our reading: Betis deserve credit for converting match situations into wins. The model gap is a reason to investigate how sustainable that is — not evidence that their results were undeserved.
Atlético Madrid: Strong Results From a Smaller xG Edge
Atlético have 28 points against 20.46 xPts (+7.54). Their expected-goal difference is a positive +5.72 (19.32 xG, 13.60 xGA), but their actual goal difference is +13. They have scored 23 times and conceded 10. That suggests production at both ends has been better than this model’s chance-quality baseline.
Still, Atlético’s recent 1–2 defeat at home to Barcelona shows that efficiency is not immunity from setbacks. Our Atlético–Barcelona match report covers the decisive moments.
Real Sociedad: Fifth Place Despite Negative xG Difference
Real Sociedad’s 22 points compare with just 16.00 xPts (+6.00). They have scored 21 times from 17.34 xG, but allowed 20 from 19.86 xGA. Their actual goal difference is +1 despite an estimated xG difference of −2.52.
Sociedad are not generating the same chance-quality advantage as the league’s title contenders. Winning close matches can sustain a high position for weeks; the question is whether performances can maintain that pattern over a larger sample.
2. Villarreal: The Biggest Underperformers (−7.87 xPts)
Villarreal: 15 points from 22.87 expected points. That is the largest negative gap in this model. What makes the situation unusual is that Villarreal’s +11.34 xG difference ranks behind only Barcelona and Real Madrid in the model, yet their actual league standing is eighth.
The most obvious disconnect is finishing. Villarreal have produced 24.22 xG but scored only 17 goals, a deficit of 7.22 goals against shot-quality expectation. Their defence has also conceded 15 goals from 12.88 xGA. Together, these discrepancies help explain why an impressive underlying chance profile has not translated into more wins.
There have been encouraging signs. Villarreal’s 2–0 win over Getafe on November 8 ended with late goals from Tajon Buchanan and Carlos Romero, following a 1–0 defeat to Espanyol in their previous home league game. That difference between a narrow loss and a late breakthrough is precisely why results alone can mislead.
Our reading: Villarreal’s chance creation merits a much closer look than eighth place suggests. But a large negative xPts gap is not a promise that their next matches will suddenly produce victories.
Málaga: Bottom of the Table, but Still Below xPts
Málaga have five actual points against 10.04 xPts (−5.04). Their 9 goals from 11.50 xG suggest some finishing shortfall, but the bigger problem is broader: they have conceded 23 goals and have a strongly negative expected-goal difference (−9.33). Even an improvement towards their model expectation would not by itself imply a safe league position.
Elche, Valencia and Celta: Different Problems, Similar Gaps
- Elche: 10 points versus 14.46 xPts (−4.46). Their 14.25 xG and 20.32 xGA indicate that the underlying balance still needs work.
- Valencia: 9 versus 12.82 xPts (−3.82). They have scored eight goals against 11.78 xG; their league position reflects weak attacking output as well as a difficult defensive record.
- Celta Vigo: 13 versus 16.48 xPts (−3.48). Celta have a near-even +0.44 xG difference but have drawn seven of 12 matches. Turning balanced performances into wins is a distinct challenge from Villarreal’s finishing gap.
Barcelona vs Real Madrid: Are the Title Contenders Overperforming?
| Metric | Barcelona | Real Madrid |
|---|---|---|
| Actual points | 33 | 30 |
| Expected points | 28.71 | 27.87 |
| Actual goals | 48 | 31 |
| Expected goals (xG) | 39.61 | 29.81 |
| Expected goals against (xGA) | 13.37 | 11.28 |
| Actual minus expected points | +4.29 | +2.13 |
Both clubs have earned more points than the model projects, but Barcelona lead by a wide margin on chance quality: +26.24 xG difference versus Real Madrid’s +18.53. Barcelona’s 48 actual goals are 8.39 above xG, while Madrid’s 31 goals are 1.19 above xG. Madrid, however, have allowed fewer expected goals (11.28 versus 13.37).
These figures suggest Barcelona’s attacking dominance is supported by strong chance creation as well as clinical finishing. They also show that Madrid remain close enough on expected points for the title race to be more competitive underneath the headline goal totals. For updated positions, see the league table.
The Most Revealing Comparison: Betis vs Villarreal
- Actual standings: Betis 26 points; Villarreal 15 — Betis lead by 11 points.
- Expected points: Betis 16.74 xPts; Villarreal 22.87 — the model favours Villarreal by 6.13 expected points.
- Result-versus-model gap: Betis +9.26; Villarreal −7.87 — a 17.13-point contrast between their relative performances.
That does not mean the league table should be rewritten or that Villarreal would necessarily beat Betis. It reveals how the same 12-match period can reward one team heavily for the timing and outcome of chances while leaving another with a weak points return despite good underlying numbers.
How Are xG and Expected Points Calculated?
Expected goals (xG) estimates the likelihood that shots become goals, based on the characteristics of a chance. A high-quality one-on-one chance generally receives more xG than a speculative shot from distance. Adding all of a team’s chances gives its xG; adding opponents’ chances gives xGA.
Expected points (xPts) goes further. The xgEdge model estimates match-result probabilities from each game’s xG totals and awards an expected value of three points for a win and one for a draw, then sums those values across the season. The comparison in this article is:
Actual league points − model expected points (xPts)
- Positive: The team collected more points than this chance-quality model estimated.
- Negative: The team collected fewer points than the model estimated.
- Neither is proof of luck: Goalkeepers, finishing skill, game state, penalties, dismissals, opposition quality and model limitations all matter.
Model differences matter. As a cross-check, xGenius’s independent LaLiga table also identifies Betis as the main positive xPts outlier and Villarreal as the main negative one, although its precise xG and xPts values differ. We do not mix providers within our calculations.
Small-sample warning: Twelve matches are not a season. A team can outperform an xG model for valid tactical and technical reasons, and a trailing club may still need substantial tactical changes. This article is a descriptive analysis, not a betting recommendation or a prediction of future results.
What to Watch in Matchday 13
Two upcoming fixtures offer immediate tests of the patterns above:
- Sevilla vs Real Betis — November 21: Can Betis maintain their strong points return against their rivals? Our Sevilla–Betis derby preview covers team news and tactics.
- Barcelona vs Villarreal — November 22: The league’s strongest xG difference meets its biggest points underperformer. Read the Barcelona–Villarreal matchup analysis for selection questions and the key battles.
For the complete round and kickoff times, see LaLiga Matchday 13 fixtures and games to watch. This article’s table is a pre-Matchday 13 snapshot; it will need a new check once those matches are completed.
LaLiga xG and Expected Points FAQs
At the November 16 snapshot, Real Betis have 26 points versus 16.74 model expected points, a +9.26 gap — the largest positive difference in the xgEdge model.
Villarreal sit 7.87 points below the model (15 real points, 22.87 xPts). Their 17 goals from 24.22 xG suggest finishing has contributed to the gap.
No. xPts is a statistical model, not an official verdict. Players, game management, goalkeeping and small-sample variation can contribute to outcomes beyond modeled averages.
Providers differ in shot data, chance-quality models and expected-points calculations. Compare teams using one consistent model and note the source and check date.
No. The figures cover matches completed through November 8, 2026 and were checked on November 16. They will change as the season continues.
More LaLiga Coverage
- LaLiga Standings 2026/27 — Current Table
- LaLiga 2026/27 Statistics Hub
- Matchday 12 Highlights: Results, Winners and Losers
- Matchday 13 Preview: Fixtures and Kickoff Times
- Sevilla vs Real Betis: Team News and Derby Analysis
- Barcelona vs Villarreal: Matchday 13 Analysis
Data and verification — November 16, 2026: Actual standings, goals for/against and matches played verified against LaLiga official standings. xG, xGA and xPts sourced consistently from xgEdge’s 2026/27 table; independently compared with the broad rankings on xGenius. Our points-minus-xPts rankings, goals-minus-xG comparisons and Betis–Villarreal contrast are editorial calculations from those stated data. All figures describe the completed Matchday 12 snapshot, not live or guaranteed future outcomes.
